So far, we have used the console to display messages, which helps us visualize certain values at specific moments and verify that some parts of the code has been executed. However, there are other tools that can also assist us.
Breakpoints
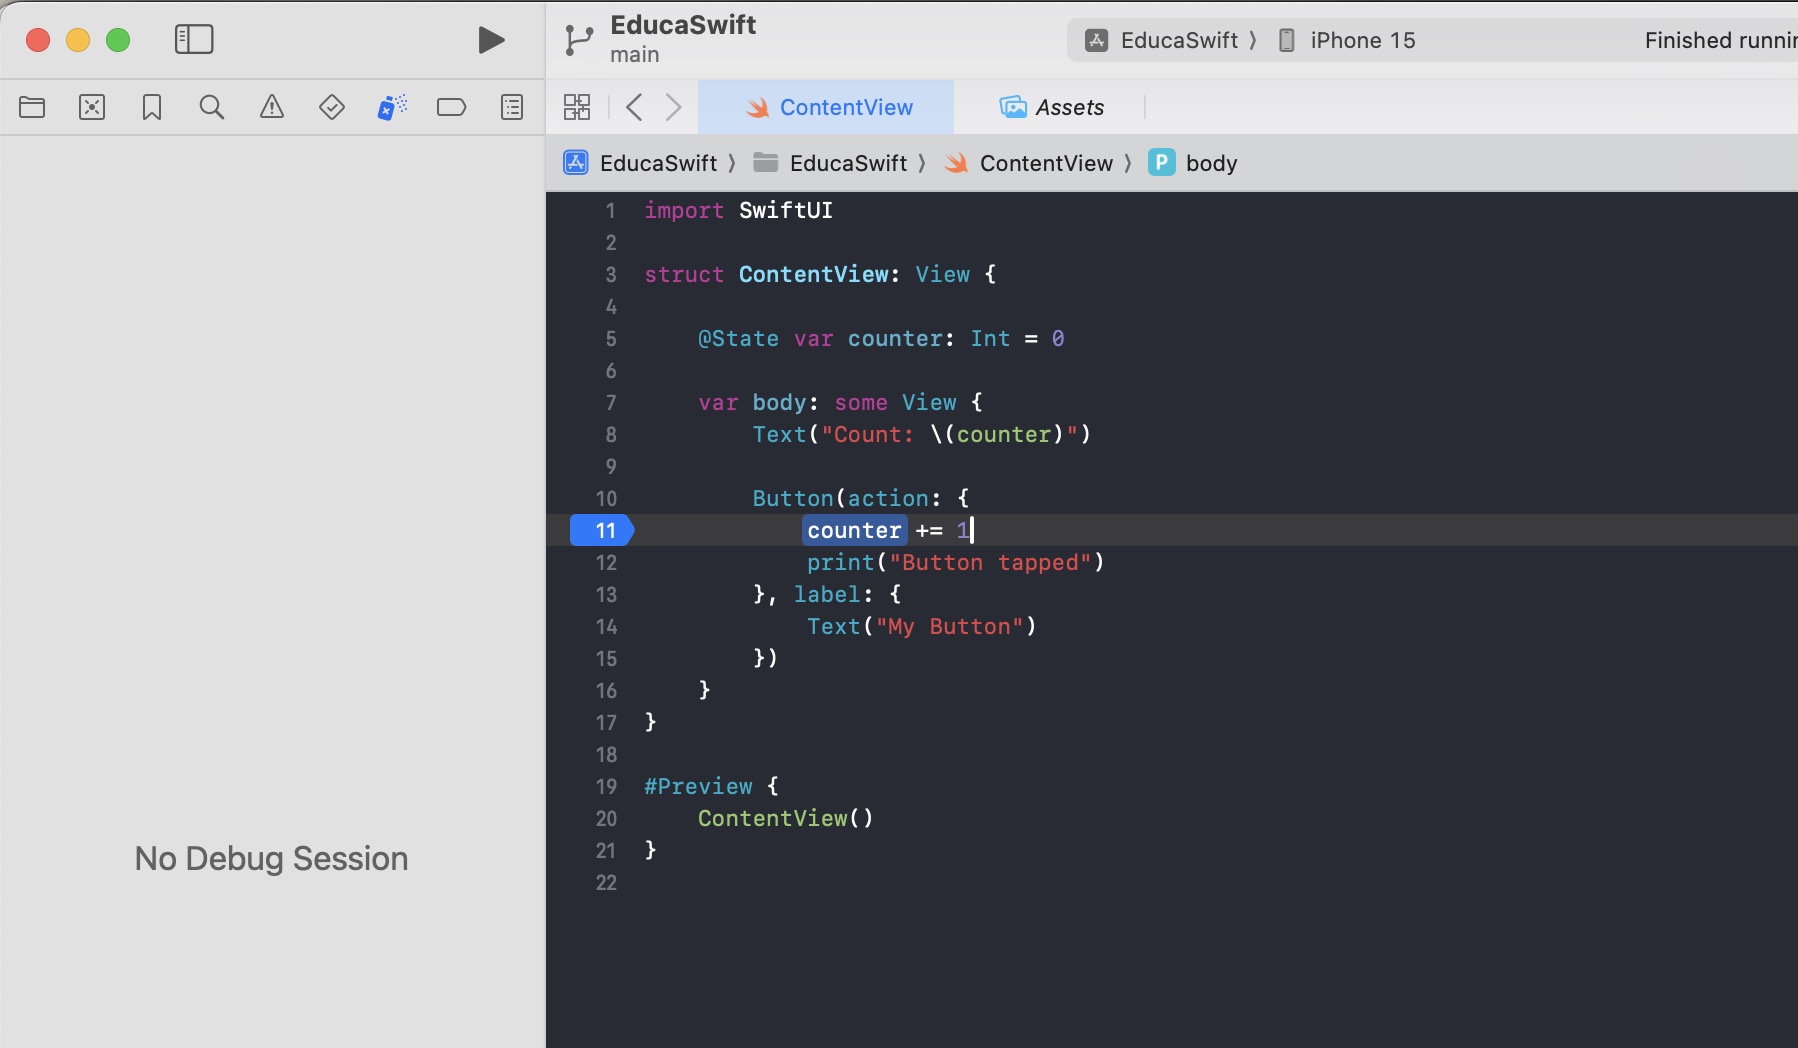
Breakpoints stops the execution of our code at a specific line. To do this, you just need to click on the left side of the line of the code where you want to pause. If you click on it again it will be deactivated, and if you click and drag, it will be removed.
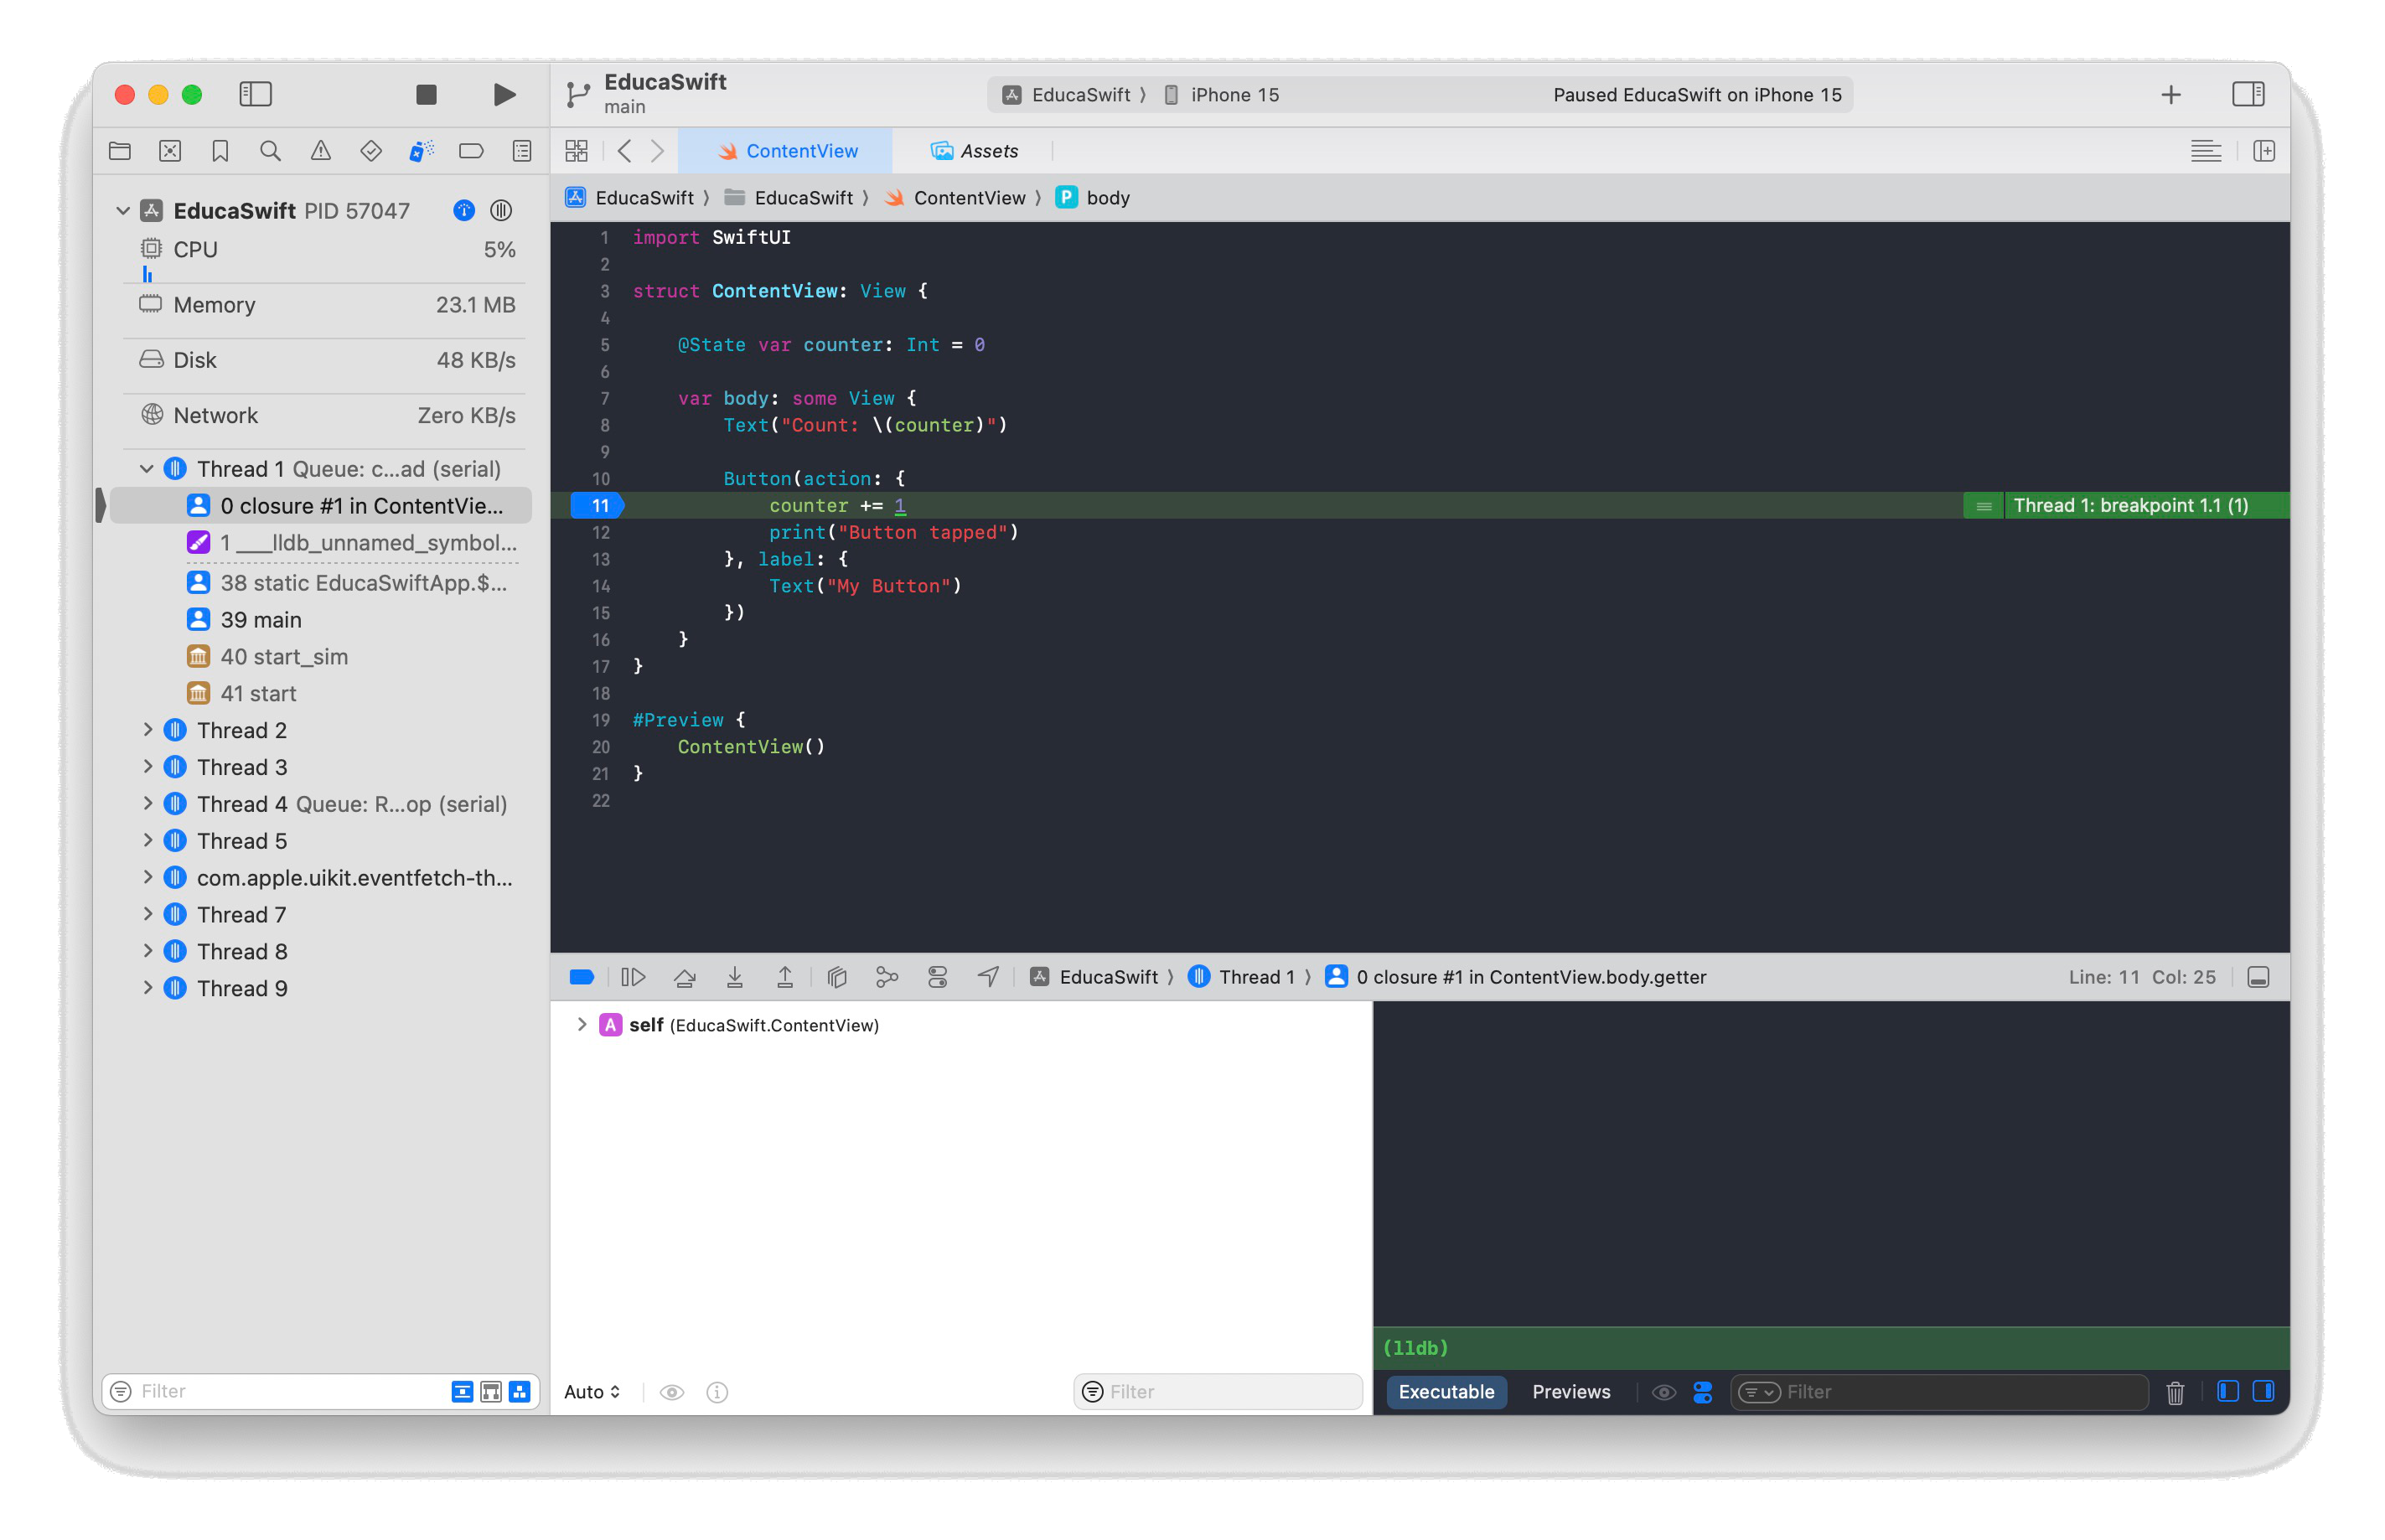
Our App will run as usual, but when we tap our button the execution will pause:
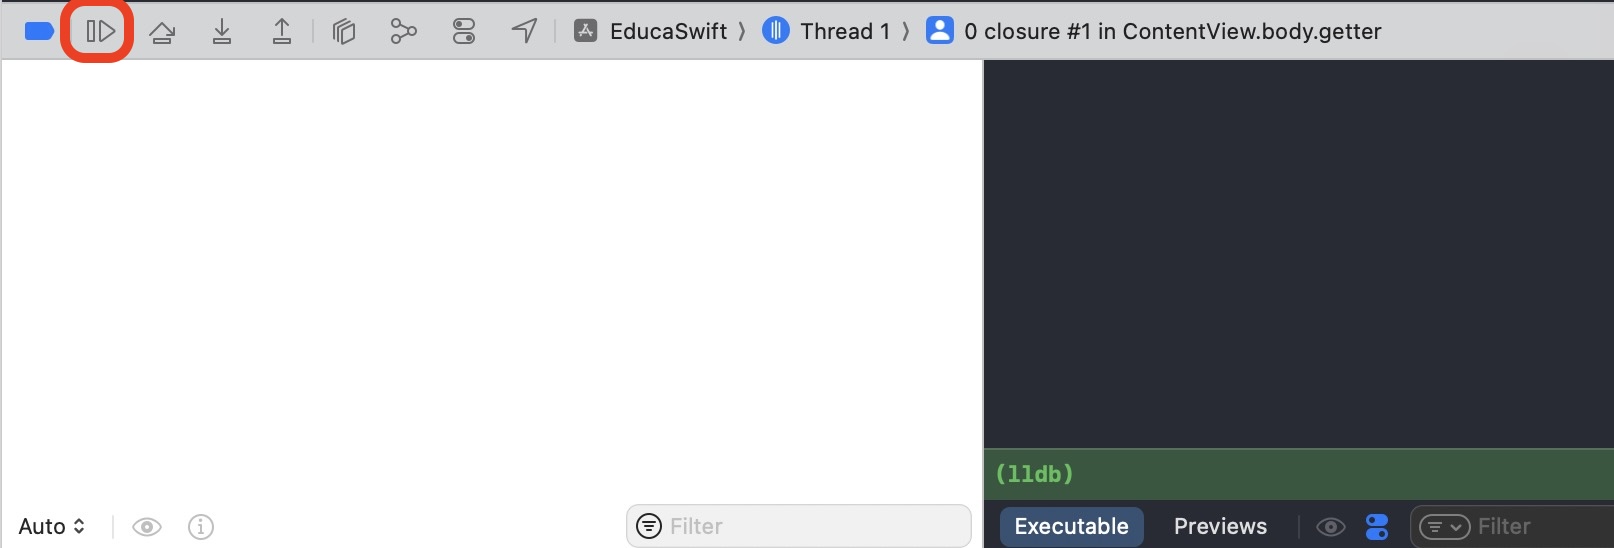
To continue the execution, we can click the icon above the console. The execution won't get paused again until it reaches another breakpoint. We'll see later how to get some info of the App state when execution is paused.
Breakpoints List
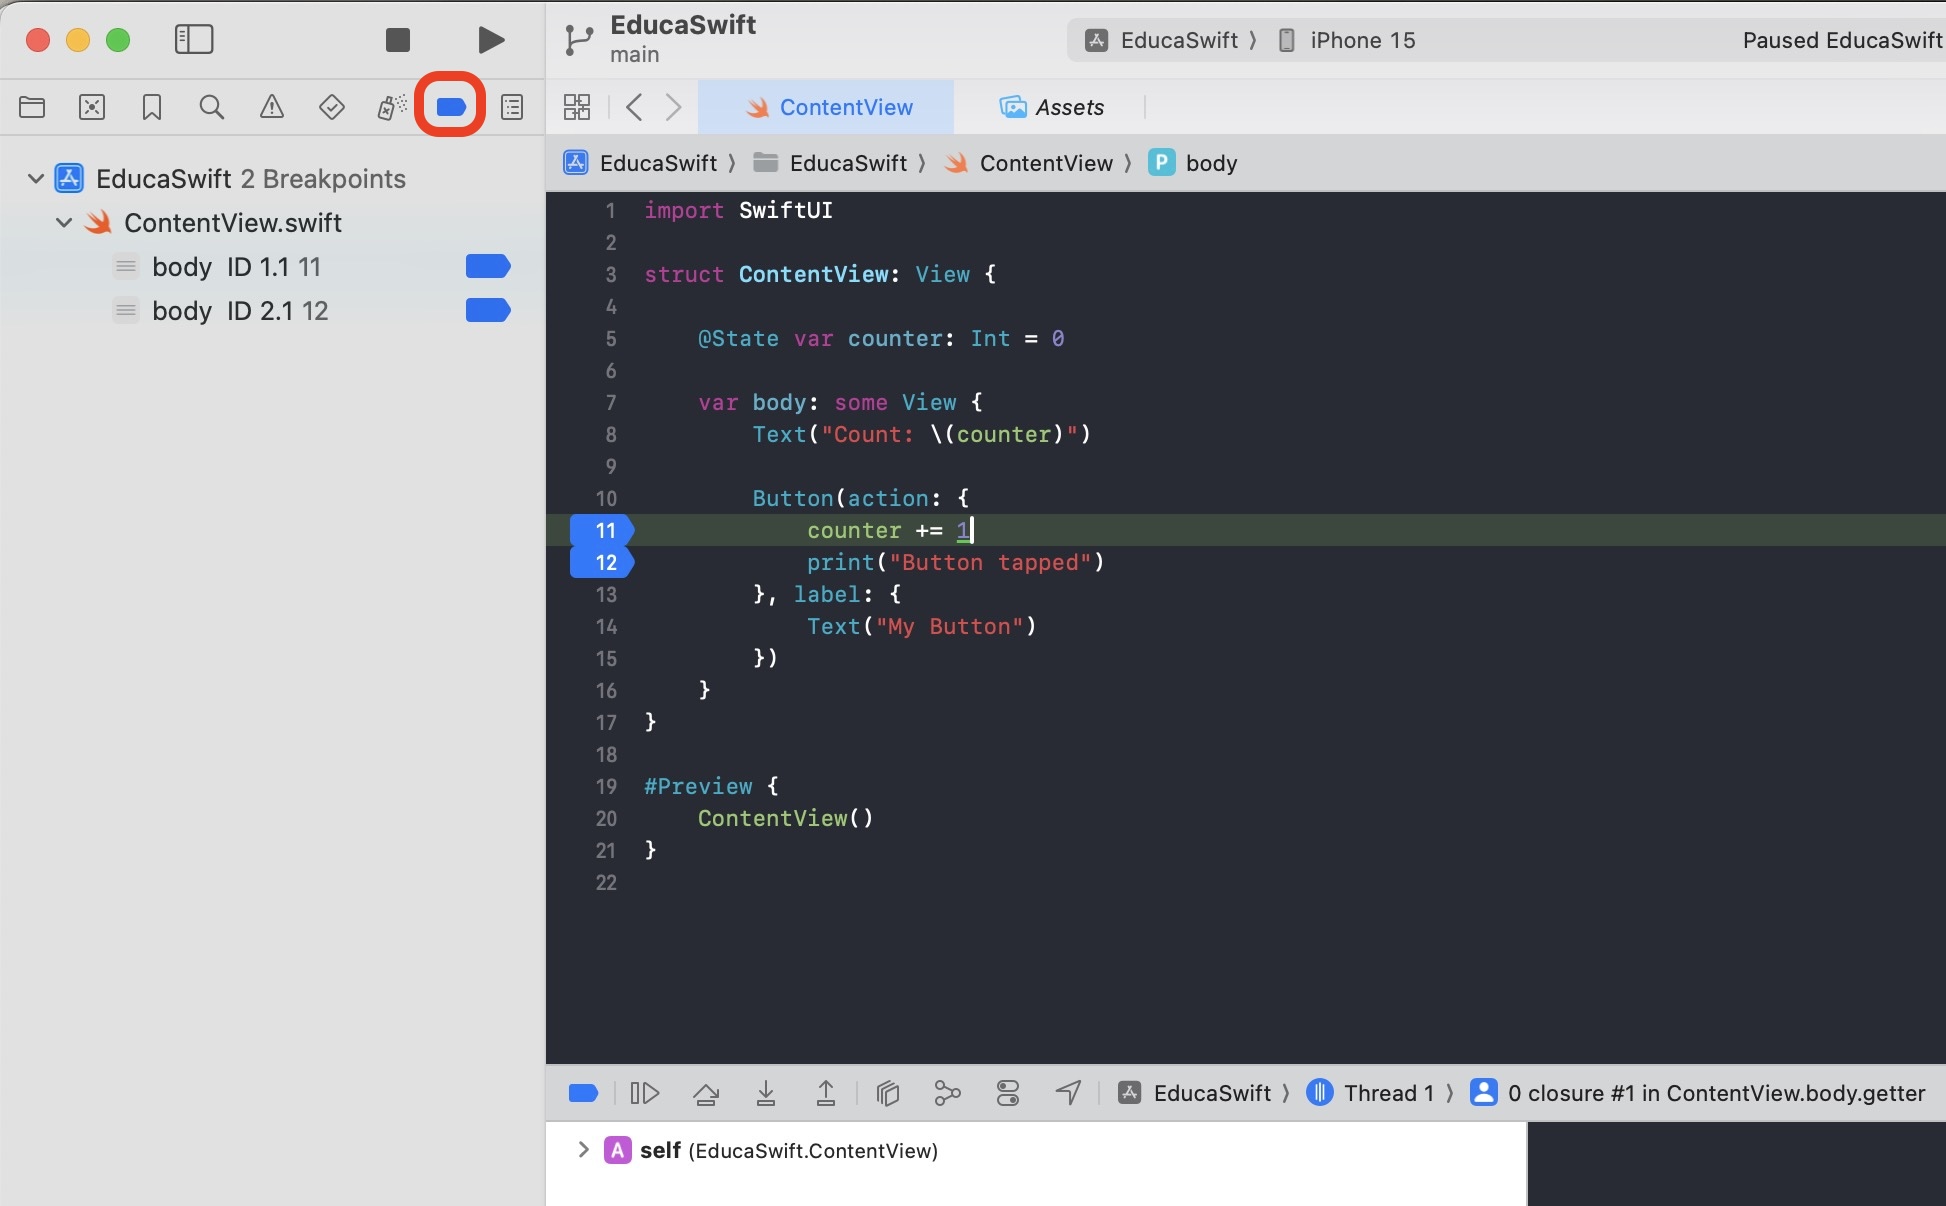
We can view the full list of breakpoints in our project under the "Breakpoints navigator" tab. We can also enable, disable, or remove them from there.
Disable Breakpoints
The icon above the console will activate or deactivate all breakpoints without removing them.
Debug Info
When the App execution is paused at a breakpoint, we will have a list of variables present in that part of the code.
As you can see the value of the variable counter is 0 because the line of the breakpoint has neven been executed before. If we continue the execution and tap the button to pause the execution again, the value of the counter variable will be 1 at that moment.
Print Object
We also have the option to use the po command in the console to obtain information about objects present in this part of the code.


Be the first to comment